SEIR Epidemic: Difference between revisions
RobertLampel (talk | contribs) Created page with "{{Dimensions |nd = 1 |nx = 4 |nw = 1 }} The '''SEIR epidemic optimal control problem''' is a classical benchmark in mathematical epidemiology and optimal control of biological systems. This description is taken from [1]. It models the spread of an infectious disease through a homogeneous population divided into four compartments: susceptible (<math>S</math>), exposed (<math>E</math>), infectious (<math>I</math>), and recovered (<math>R..." |
RobertLampel (talk | contribs) No edit summary |
||
| (One intermediate revision by the same user not shown) | |||
| Line 2: | Line 2: | ||
|nd = 1 | |nd = 1 | ||
|nx = 4 | |nx = 4 | ||
|nw = | |nw = 2 | ||
}} | }} | ||
The '''SEIR epidemic optimal control problem''' | The '''SEIR epidemic optimal control problem''' models the spread of an infectious disease through a homogeneous population divided into four compartments: susceptible (<math>S</math>), exposed (<math>E</math>), infectious (<math>I</math>), and recovered (<math>R</math>). | ||
Two controls are applied simultaneously: a vaccination rate that removes susceptible individuals from the transmission chain, and a social-distancing intensity that reduces the effective contact rate. | |||
The objective is to minimise a weighted combination of the cumulative infectious burden and the quadratic costs of both interventions over a finite horizon, yielding a trade-off between disease suppression and resource expenditure. | |||
The problem is nonlinear and non-convex and is calibrated to a COVID-19-like baseline scenario. | |||
The objective is to minimise a weighted combination of the cumulative infectious burden and the | |||
The problem is nonlinear and non-convex | |||
== Mathematical formulation == | == Mathematical formulation == | ||
| Line 16: | Line 14: | ||
<math> | <math> | ||
\begin{array}{lll} | \begin{array}{lll} | ||
\displaystyle \min_{ | \displaystyle \min_{u_1,\,u_2} && \displaystyle\int_0^{T} \Bigl[ A\, I(t) + B\, u_1(t)^2 + C\, u_2(t)^2 \Bigr]\, \mathrm{d}t \\[8pt] | ||
\text{subject to} \\ | \text{subject to} \\[4pt] | ||
\quad \dot{S}(t) &=& -\beta\, S(t)\, I(t) - | \quad \dot{S}(t) &=& -\beta\,(1 - u_2(t))\,S(t)\,I(t) - u_1(t)\,S(t), \\[4pt] | ||
\quad \dot{E}(t) &=& \beta\, S(t)\, I(t) - \sigma\, E(t), \\ | \quad \dot{E}(t) &=& \beta\,(1 - u_2(t))\,S(t)\,I(t) - \sigma\,E(t), \\[4pt] | ||
\quad \dot{I}(t) &=& \sigma\, E(t) - \gamma\, I(t), \\ | \quad \dot{I}(t) &=& \sigma\,E(t) - \gamma\,I(t), \\[4pt] | ||
\quad \dot{R}(t) &=& \gamma\, I(t) + | \quad \dot{R}(t) &=& \gamma\,I(t) + u_1(t)\,S(t), \\[4pt] | ||
\quad x(0) &=& (S_0,\; E_0,\; I_0,\; R_0)^T, \\ | \quad x(0) &=& (S_0,\; E_0,\; I_0,\; R_0)^T, \\ | ||
\quad | \quad u_1(t) &\in& [0,\, u_{1,\max}] \quad \forall\, t \in [0, T], \\ | ||
\quad u_2(t) &\in& [0,\, u_{2,\max}] \quad \forall\, t \in [0, T], | |||
\end{array} | \end{array} | ||
</math> | </math> | ||
| Line 30: | Line 29: | ||
where <math>x = (S, E, I, R)^T</math>. | where <math>x = (S, E, I, R)^T</math>. | ||
All compartments are fractions of the total population, so <math>S(t) + E(t) + I(t) + R(t) = 1</math> for all <math>t</math>. | All compartments are fractions of the total population, so <math>S(t) + E(t) + I(t) + R(t) = 1</math> for all <math>t</math>. | ||
The term <math>- | |||
The | The first control <math>u_1(t) \in [0, u_{1,\max}]</math> is the vaccination rate: the term <math>-u_1(t)\,S(t)</math> removes susceptible individuals through vaccination, moving them directly to the recovered compartment at rate <math>u_1(t)\,S(t)</math>. | ||
The second control <math>u_2(t) \in [0, 1]</math> is the social-distancing intensity: <math>u_2 = 0</math> corresponds to no intervention and <math>u_2 = 1</math> to full isolation. | |||
It enters multiplicatively as <math>(1 - u_2(t))</math> in the force of infection <math>\beta\,(1-u_2)\,S\,I</math>, reducing effective contacts without directly removing individuals from any compartment. | |||
The quadratic penalties <math>B\,u_1^2</math> and <math>C\,u_2^2</math> model the increasing marginal cost of each intervention. | |||
== Parameters == | == Parameters == | ||
| Line 40: | Line 44: | ||
! Symbol !! Value !! Description | ! Symbol !! Value !! Description | ||
|- | |- | ||
| align=center | <math>\beta</math> || align=right | 0.5 || | | align=center | <math>\beta</math> || align=right | 0.5 || Contact (transmission) rate (day<sup>−1</sup>) | ||
|- | |||
| align=center | <math>\sigma</math> || align=right | 0.2 || Progression rate from exposed to infectious (day<sup>−1</sup>) | |||
|- | |||
| align=center | <math>\gamma</math> || align=right | 0.1 || Recovery rate (day<sup>−1</sup>) | |||
|- | |||
| align=center | <math>A</math> || align=right | 1 || Weight on infectious burden | |||
|- | |- | ||
| align=center | <math> | | align=center | <math>B</math> || align=right | 1 || Quadratic cost weight on vaccination | ||
|- | |- | ||
| align=center | <math> | | align=center | <math>C</math> || align=right | 1 || Quadratic cost weight on social distancing | ||
|- | |- | ||
| align=center | <math> | | align=center | <math>u_{1,\max}</math> || align=right | 0.10 || Maximum vaccination rate (day<sup>−1</sup>) | ||
|- | |- | ||
| align=center | <math>u_{\max}</math> || align=right | | | align=center | <math>u_{2,\max}</math> || align=right | 1.00 || Maximum social-distancing intensity | ||
|- | |- | ||
| align=center | <math>S_0</math> || align=right | 0. | | align=center | <math>S_0</math> || align=right | 0.990 || Initial susceptible fraction | ||
|- | |- | ||
| align=center | <math>E_0</math> || align=right | 0. | | align=center | <math>E_0</math> || align=right | 0.005 || Initial exposed fraction | ||
|- | |- | ||
| align=center | <math>I_0</math> || align=right | 0 || Initial infectious fraction | | align=center | <math>I_0</math> || align=right | 0.005 || Initial infectious fraction | ||
|- | |- | ||
| align=center | <math>R_0</math> || align=right | 0 || Initial recovered fraction | | align=center | <math>R_0</math> || align=right | 0 || Initial recovered fraction | ||
|- | |- | ||
| align=center | <math> | | align=center | <math>T</math> || align=right | 100 || Planning horizon (days) | ||
|} | |} | ||
| Line 66: | Line 76: | ||
<gallery caption="Reference solution plots" widths="500px" heights="300px" perrow="1"> | <gallery caption="Reference solution plots" widths="500px" heights="300px" perrow="1"> | ||
Image: SEIR_Epidemic.png | Compartment trajectories and optimal vaccination | Image:SEIR_Epidemic.png| Compartment trajectories and optimal vaccination and social-distancing schedules for a reference solution. | ||
</gallery> | </gallery> | ||
| Line 72: | Line 82: | ||
The basic reproduction number for the uncontrolled SEIR model is <math>\mathcal{R}_0 = \beta/\gamma</math>. | The basic reproduction number for the uncontrolled SEIR model is <math>\mathcal{R}_0 = \beta/\gamma</math>. | ||
With the parameters above, <math>\mathcal{R}_0 = 5</math>, corresponding to a highly transmissible pathogen. | With the parameters above, <math>\mathcal{R}_0 = 5</math>, corresponding to a highly transmissible pathogen. | ||
The | The two-control formulation combines pharmaceutical intervention (vaccination) with non-pharmaceutical intervention (social distancing), reflecting the dual-measure response used during the COVID-19 pandemic. | ||
Necessary optimality conditions via Pontryagin's minimum principle lead to a coupled system of state and adjoint ODEs; the optimal control typically exhibits a bang–singular–bang structure for the vaccination arc and a smooth interior arc for social distancing. | |||
== References == | == References == | ||
<span id=" | <span id="Behncke2000">[1]</span> Behncke, H. (2000). Optimal control of deterministic epidemics. Optimal Control Applications and Methods, 21(6), 269–285.<br> | ||
<span id=" | <span id="Perkins2020">[2]</span> Perkins, T. A., & España, G. (2020). Optimal control of the COVID-19 pandemic with non-pharmaceutical interventions. Bulletin of Mathematical Biology, 82, 118.<br> | ||
[[Category:MIOCP]] | |||
[[Category:ODE model]] | [[Category:ODE model]] | ||
Latest revision as of 11:28, 4 September 2026
| SEIR Epidemic | |
|---|---|
| State dimension: | 1 |
| Differential states: | 4 |
| Discrete control functions: | 2 |
The SEIR epidemic optimal control problem models the spread of an infectious disease through a homogeneous population divided into four compartments: susceptible (), exposed (), infectious (), and recovered (). Two controls are applied simultaneously: a vaccination rate that removes susceptible individuals from the transmission chain, and a social-distancing intensity that reduces the effective contact rate. The objective is to minimise a weighted combination of the cumulative infectious burden and the quadratic costs of both interventions over a finite horizon, yielding a trade-off between disease suppression and resource expenditure. The problem is nonlinear and non-convex and is calibrated to a COVID-19-like baseline scenario.
Mathematical formulation
where . All compartments are fractions of the total population, so for all .
The first control is the vaccination rate: the term removes susceptible individuals through vaccination, moving them directly to the recovered compartment at rate .
The second control is the social-distancing intensity: corresponds to no intervention and to full isolation. It enters multiplicatively as in the force of infection , reducing effective contacts without directly removing individuals from any compartment.
The quadratic penalties and model the increasing marginal cost of each intervention.
Parameters
These fixed values are used within the model:
| Symbol | Value | Description |
|---|---|---|
| 0.5 | Contact (transmission) rate (day−1) | |
| 0.2 | Progression rate from exposed to infectious (day−1) | |
| 0.1 | Recovery rate (day−1) | |
| 1 | Weight on infectious burden | |
| 1 | Quadratic cost weight on vaccination | |
| 1 | Quadratic cost weight on social distancing | |
| 0.10 | Maximum vaccination rate (day−1) | |
| 1.00 | Maximum social-distancing intensity | |
| 0.990 | Initial susceptible fraction | |
| 0.005 | Initial exposed fraction | |
| 0.005 | Initial infectious fraction | |
| 0 | Initial recovered fraction | |
| 100 | Planning horizon (days) |
Reference Solutions
Here is one local solution to the above control problem.
- Reference solution plots
-
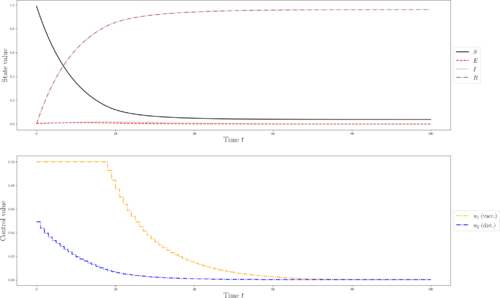 Compartment trajectories and optimal vaccination and social-distancing schedules for a reference solution.

Miscellaneous and Further Reading
The basic reproduction number for the uncontrolled SEIR model is . With the parameters above, , corresponding to a highly transmissible pathogen. The two-control formulation combines pharmaceutical intervention (vaccination) with non-pharmaceutical intervention (social distancing), reflecting the dual-measure response used during the COVID-19 pandemic. Necessary optimality conditions via Pontryagin's minimum principle lead to a coupled system of state and adjoint ODEs; the optimal control typically exhibits a bang–singular–bang structure for the vaccination arc and a smooth interior arc for social distancing.
References
[1] Behncke, H. (2000). Optimal control of deterministic epidemics. Optimal Control Applications and Methods, 21(6), 269–285.
[2] Perkins, T. A., & España, G. (2020). Optimal control of the COVID-19 pandemic with non-pharmaceutical interventions. Bulletin of Mathematical Biology, 82, 118.