Oil shale pyrolysis (GEKKO)
From mintOC
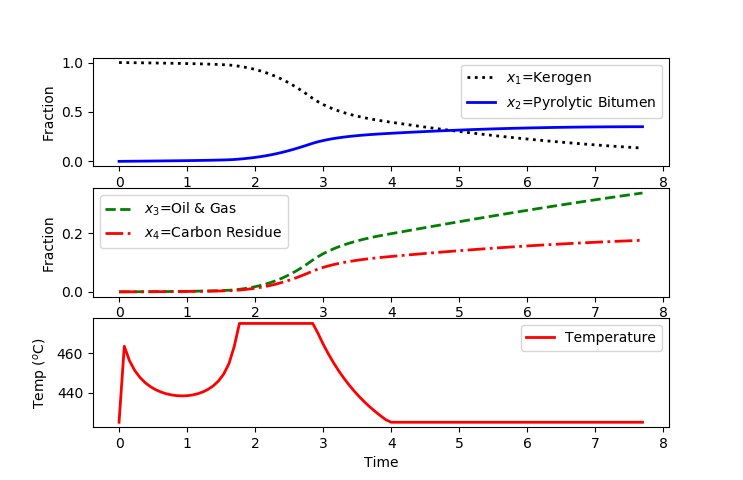
This page contains a solution of the Oil Shale Pyrolysis problem in GEKKO Python format. The model in Python code for a fixed control discretization grid uses orthogonal collocation and a simultaneous optimization method. The GEKKO package is available with pip install gekko.
from gekko import GEKKO
import numpy as np
import matplotlib.pyplot as plt

m=GEKKO()

nt = 101
m.time = np.linspace(0,1,nt)

# Constants
R = m.Const(value=1.9858775e-3) # Gas constant [kcal/mol*K]

# Final Time = FV
tf = m.FV(value=1,lb=0.1,ub=20)
tf.STATUS = 1

# MV
T = m.MV(value=425, ub=475, lb=425) # degC
T.STATUS = 1
T.DCOST = 0

# Variables
x1 = m.Var(value = 1) # kerogen
x2 = m.Var(value = 0) # pyrolytic bitumen
x3 = m.Var(value = 0) # oil and gas
x4 = m.Var(value = 0) # carbon residue

p = np.zeros(nt)
p[-1] = 1.0
final = m.Param(value=p)

# Parameters
# Frequency factor
a1 = m.Param(value=np.exp(8.86))
a2 = m.Param(value=np.exp(24.25))
a3 = m.Param(value=np.exp(23.67))
a4 = m.Param(value=np.exp(18.75))
a5 = m.Param(value=np.exp(20.7))
# Activation envergy [Kcal/g-mole]
b1 = m.Param(value=20.3)
b2 = m.Param(value=37.4)
b3 = m.Param(value=33.8)
b4 = m.Param(value=28.2)
b5 = m.Param(value=31.0)

# Intermediates
k1 = m.Intermediate(a1 * m.exp(-b1/(R*(T+273.15))))
k2 = m.Intermediate(a2 * m.exp(-b2/(R*(T+273.15))))
k3 = m.Intermediate(a3 * m.exp(-b3/(R*(T+273.15))))
k4 = m.Intermediate(a4 * m.exp(-b4/(R*(T+273.15))))
k5 = m.Intermediate(a5 * m.exp(-b5/(R*(T+273.15))))

# Equations
m.Equation(x1.dt()/tf == -k1*x1 - (k3 + k4 + k5) * x1*x2)
m.Equation(x2.dt()/tf == k1*x1 - k2*x2 + k3*x1*x2)
m.Equation(x3.dt()/tf == k2*x2 + k4*x1*x2)
m.Equation(x4.dt()/tf == k5*x1*x2)

# Objective function
m.Obj(-final*x2)

m.options.SOLVER = 3
m.options.IMODE = 6
m.solve()

plt.figure(1)

tm = m.time * tf.value[0]

plt.subplot(3,1,1)
plt.plot(tm,x1.value,'k:',LineWidth=2,label=r'$x_1$=Kerogen')
plt.plot(tm,x2.value,'b-',LineWidth=2,label=r'$x_2$=Pyrolytic Bitumen')
plt.ylabel('Fraction')
plt.legend(loc='best')

plt.subplot(3,1,2)
plt.plot(tm,x3.value,'g--',LineWidth=2,label=r'$x_3$=Oil & Gas')
plt.plot(tm,x4.value,'r-.',LineWidth=2,label=r'$x_4$=Carbon Residue')
plt.ylabel('Fraction')
plt.legend(loc='best')

plt.subplot(3,1,3)
plt.plot(tm,T.value,'r-',LineWidth=2,label='Temperature')
plt.legend(loc='best')
plt.xlabel('Time')
plt.ylabel(r'Temp ($^o$C)')

plt.show()
A solution is calculated with an objective function value of  .
.
Thanks to Junho Park for providing the solution.
